How to create charts in Figma and XD extremely easily and quickly

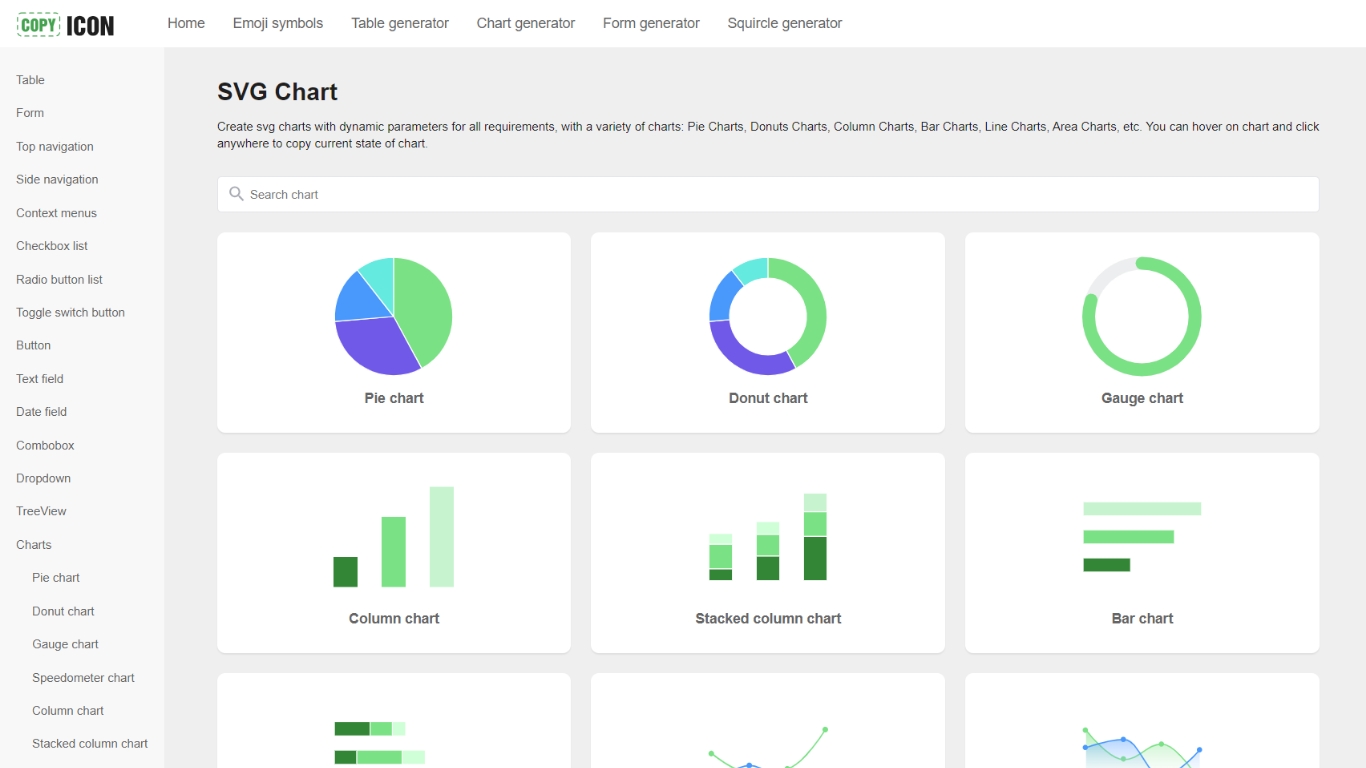
To start drawing charts, please visit: https://copyicon.com/generator/svg-chart and search for the type of chart you want to create.
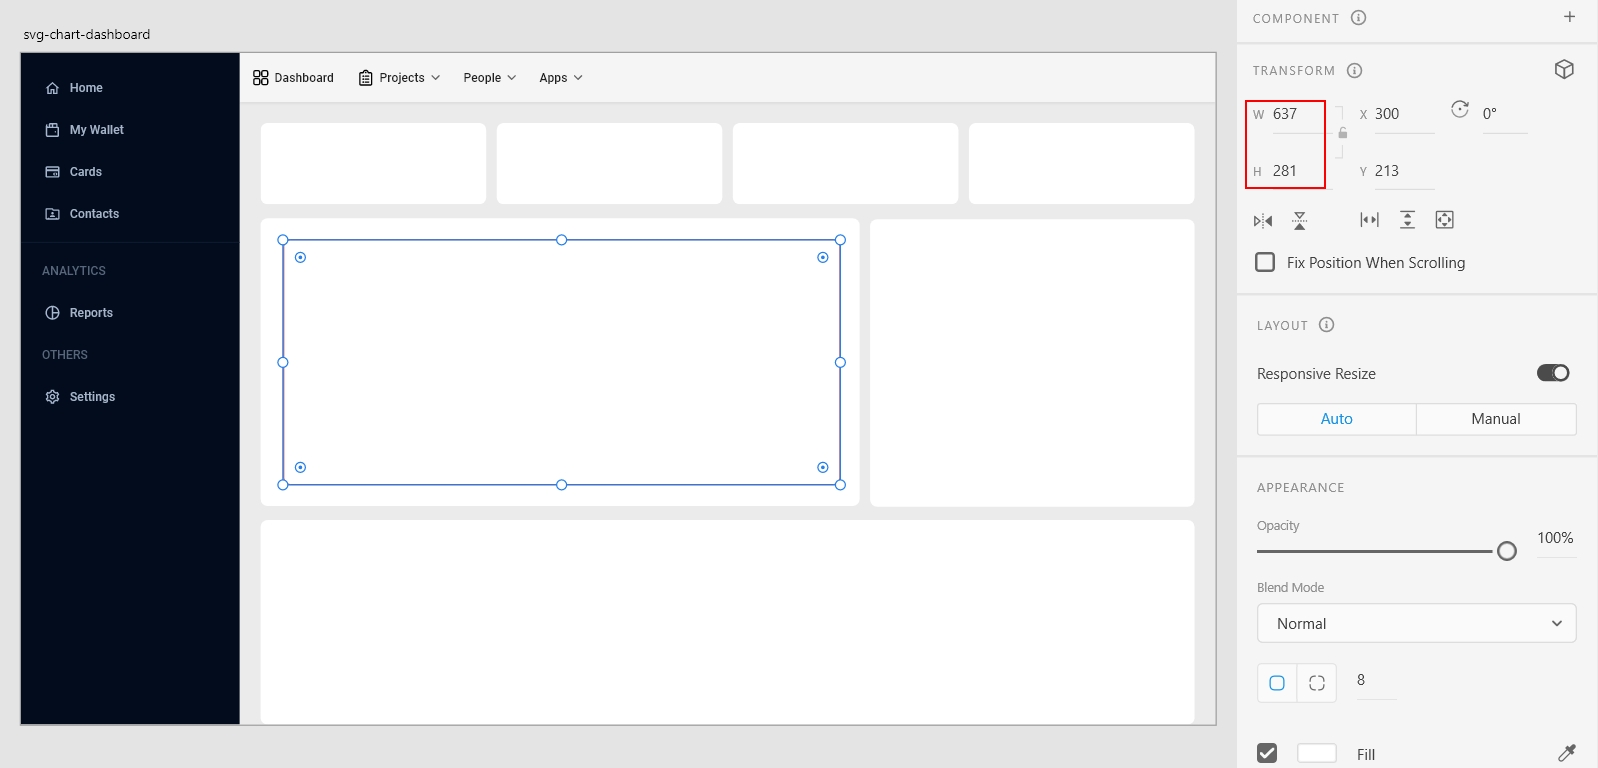
You can determine the size for drawing the chart by using design tools to measure the dimensions of the desired chart and entering them into the CopyIcon Chart tool.
In the interface on the right-hand side, you can choose to enable or disable properties and customize sample data such as data names and values. You can also add multiple slices, bars, lines, etc., in the charts. In the middle, you will see a preview of how the chart will look like.
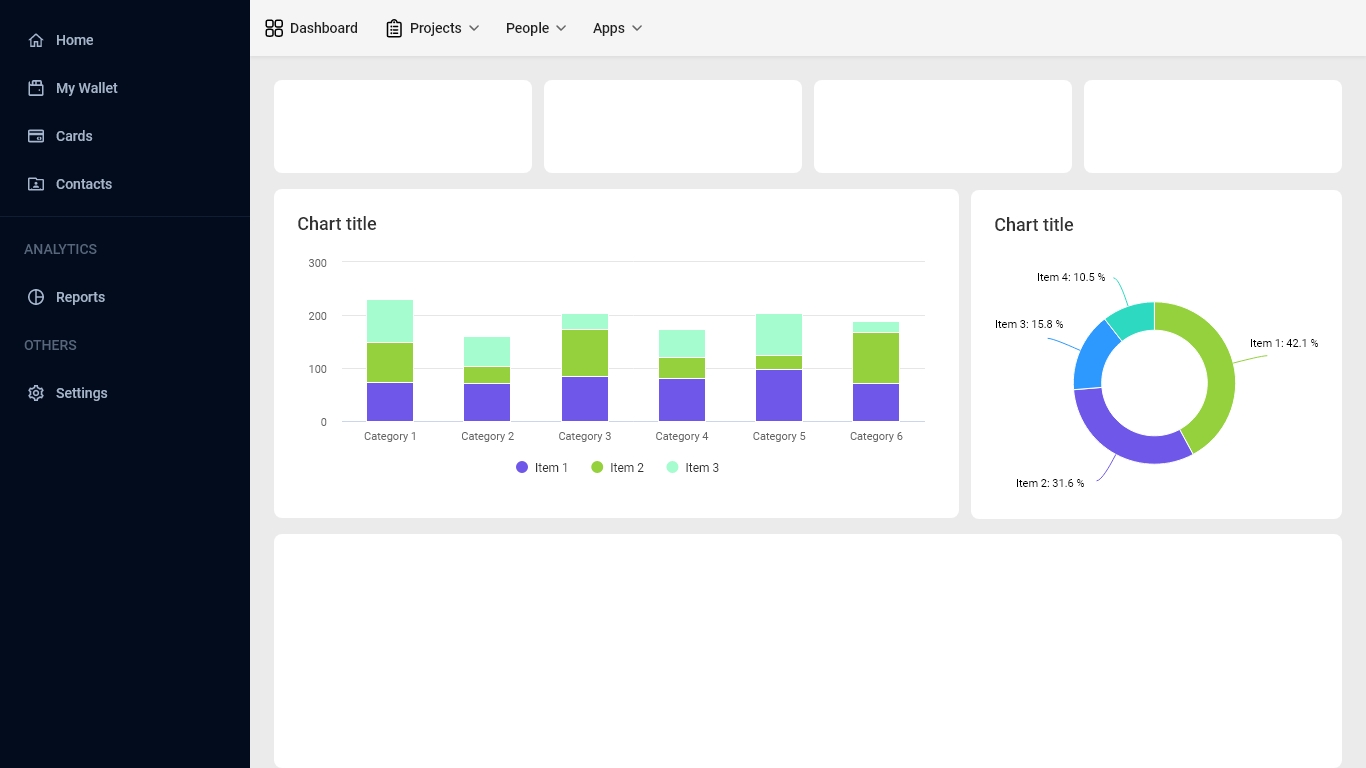
After that, you just need to copy and paste it into Figma or XD for further editing if needed.
It's really easy, isn't it? That's the simplest way to help you create beautiful charts quickly. If you find it useful, feel free to share it with your friends.